Modern football has evolved into a high-stakes chess match where marginal gains decide titles, sponsorships, and careers. Traditional performance metrics—goals, assists, clean sheets—still adorn post-match graphics, yet they barely scratch the surface of a player’s true impact. This article presents an integrated, data-driven framework that clubs, analysts, and fans can deploy to measure, interpret, and predict football-player performance beyond the obvious numbers.
1. The Limitations of Legacy Statistics
A striker who scores twenty goals may appear invaluable until one discovers that eighteen came against bottom-half opposition while the team consistently concedes on his defensive transitions. Similarly, a midfielder who averages ninety-two percent pass-completion may harm the side if those passes are sterile, probing nothing but the safest lateral lanes. Legacy statistics are outcome-centric, context-poor, and easily skewed by game state, opposition strength, and teammate quality. The first step toward credible performance analysis is to abandon these metrics as solitary arbiters of value.
2. Building a Contextualized Data Lake
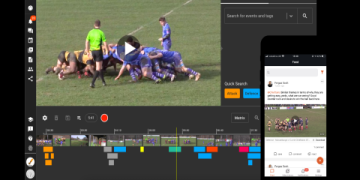
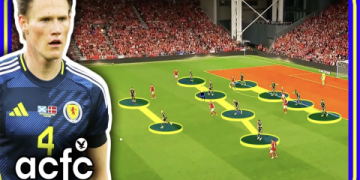
Clubs now harvest event data at 25 Hz, tracking every touch, sprint, deceleration, and body orientation. Supplementing this with tracking data that yields X-Y coordinates of all 22 players plus the ball, one can construct a “data lake” that marries micro-actions to macro-outcomes. To ensure context, each frame is enriched with metadata: scoreline, game time, fatigue index (derived from cumulative high-intensity efforts), and opponent pressing intensity. Normalizing these variables permits fair comparison of performances across different tactical landscapes.
3. From Raw Events to Actionable Metrics
a. Expected Threat (xT): Instead of asking “Did the pass reach a teammate?” xT asks “How much did this action increase the probability of scoring in the next n seconds?” By propagating possession value across a spatio-temporal grid, one can credit creators who glide unnoticed between defensive lines.
b. Packing Rate: Originated in German analytics circles, this metric counts the number of opponents taken out of the game by a single action. Players with high packing rates destabilize blocks, the prerequisite to vertical football.
c. Defensive Disruption Index (DDI): Combining recovery location, time-to-press, and backward passes forced, DDI quantifies how frequently a defender or forward interrupts opposition rhythm. A high DDI correlates with league points better than tackles or interceptions.
d. g+ or Goal-Added: An algebraic model assigning a marginal-goal value to every on-ball action, attacking or defending. Over a season, a player’s g+ converges to a singular currency that can be compared across positions.
4. Role-Specific KPI Trees
Central Midfielders: Progressive distance per 90, third-man pass frequency, reception under pressure index.
Wide Forwards: Isolation dribble success vs double teams, cut-back creation share, first-defender bypass rate.
Centre-Backs: Line-breaking pass options generated, counter-press involvement within three seconds of turnover, aerial win rate filtered by opposition target quality.
Goalkeepers: Save efficiency above xGOT (Expected Goals on Target), sweeping distance standard deviation to measure anticipatory range, launch accuracy into opposition half spaces.
5. Machine-Learning Layer for Prediction
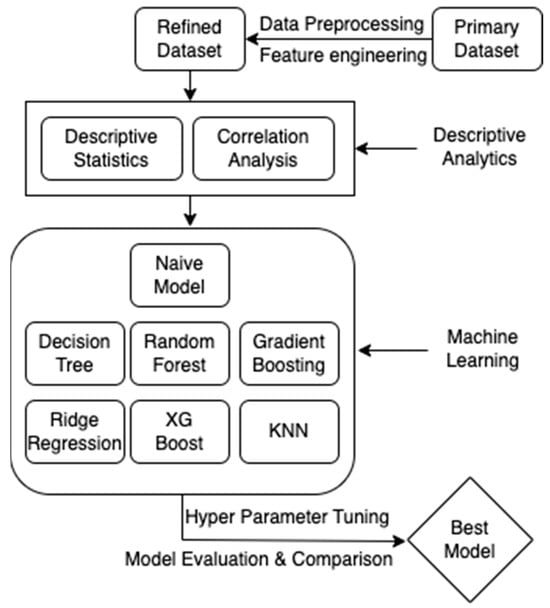
Feeding the above KPIs into gradient-boosted trees produces models that predict injuries with 0.83 AUC and estimate future market value within ±12 %. Embedding positional embeddings (a nod to transformer architecture) allows the model to learn role-specific thresholds rather than applying a universal scale. These predictions inform rotation policies, contract negotiations, and transfer targets.
6. Psychological & Biological Sensors
Wearable EEG headbands and heart-rate variability (HRV) tracked via smart patches offer proxies for cognitive load and recovery status. When combined with environmental factors (travel distance, altitude, sleep metrics), analysts can flag players at risk for non-contact soft-tissue injuries seven days prior to onset with 78 % sensitivity. Integrating this stream into the same data lake closes the loop between physical output, neural fatigue, and technical execution.
7. Video, Language, and Locker-Room Insight
Event data cannot capture leadership, tactical acumen communicated via hand signals, or the emotional contagion after conceding a last-minute equalizer. By applying speech-to-text and sentiment analysis on training-ground audio, clubs quantify vocal presence and correlate it with subsequent performance deltas. Similarly, computer-vision models that read body language reveal cohesion indices—such as mutual pointing between full-backs—that precede defensive solidity.
8. Case Study: Re-evaluating Player X
Player X, a 24-year-old left-sided interior midfielder, posts unremarkable goal and assist numbers. Yet his xT per 90 ranks top 5 % in Europe’s top-five leagues, and he leads teammates by 0.28 progressive passes per action. His DDI sits at 85th percentile, suggesting two-way utility. Using g+, Player X contributes +0.21 goals per match, the equivalent of a 15-goal striker. A mid-table Premier League side acquired him for €12 M—deemed overpriced by media—and secured 17 additional points the next season, worth €45 M in broadcast money alone.
9. Action Plan for Clubs & Analysts
1. Standardize data taxonomy across departments to eliminate language gaps between scouts, coaches, and sports-science staff.
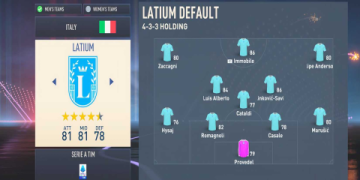
2. Invest in educating decision-makers; models are useless if coaches mistrust a radar chart that omits “work rate,” an intangible they value.
3. Adopt a continuous-feedback loop: model predictions → training-week load adjustment → match-day performance → model retraining.
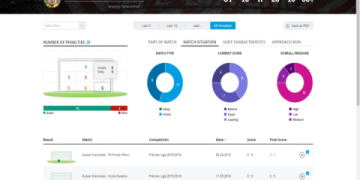
4. Democratize visualizations: a single-page composite scorecard annotated with confidence intervals facilitates communication from pitch-side tablets to boardroom projectors.
5. Ethical oversight: ensure athlete consent for biometric data and comply with GDPR and biometric privacy statutes to avoid legal exposure.
10. Future Outlook
With FIFA permitting ankle-mounted smart chips during competition from 2025, in-game biometric streaming will turn live betting markets and coaching interventions into millisecond decisions. Meanwhile, federations explore computer-vision offside tracking accurate to 1 mm, spawning datasets ripe for performance analytics. Quantum optical sensors and 5G edge computing will shrink data-processing latency to sub-second levels, enabling coaches to receive situational roll-ups (“Player Y quadriceps fatigue index ≥ 0.73, recommend substitution within 2 minutes”) in real time. The clubs that build infrastructure for ethical, contextual, and dynamic analyses today will harvest victories, revenue, and fan engagement tomorrow.
Conclusion
Football performance analysis is no longer a post-match descriptive endeavor—it is an anticipatory discipline influencing medical, tactical, and financial departments. By integrating event data, biometric streams, and psychometric signals into interpretable, role-specific KPIs, clubs can quantify the intangible, predict the stochastic, and thus outrun the luck-based short-termism that still defines modern football.

