


Introduction
The gap between winning and losing in contemporary football has narrowed to razor-thin margins. Coaches, analysts, and sporting directors increasingly rely on granular performance data rather than intuition alone. This article presents a comprehensive framework for evaluating football team performance, illustrating how objective metrics translate into tactical insights, strategic planning, and ultimately more victories.
1. From Box Score to Advanced Metrics
Traditional statistics such as goals, assists, and possession percentage barely scratch the surface. Modern analysis layers event-level tracking data on top of video, yielding metrics like Expected Goals (xG), Expected Threat (xT), and Passes per Defensive Action (PPDA). When aggregated over a season, these indicators stabilize and provide a clearer picture of style effectiveness.
2. Key Performance Pillars
a) Offensive Efficiency: xG differential (xG created vs. xG conceded) isolates finishing quality from chance creation. Elite clubs consistently outperform xG through superior shot placement and rapid ball circulation.
b) Defensive Solidity: Post-Shot xG (PSxG) measures the likelihood of a shot becoming a goal after the strike, revealing goalkeeper influence and shot-constriction ability. Teams ranked top-five in PSxG against typically concede 25 % fewer goals than mid-table sides.
c) Transition Control: Winning the ball high up the pitch shortens the path to goal. Counter-pressing intensity, quantified via PPDA in the final 40 m, correlates strongly with turnover-to-shot conversion.
d) Squad Depth & Rotation: Injury-adjusted minutes distribution shows whether rotational policies maintain performance levels. Clubs leveraging ≥ 20 players for ≥ 300 league minutes lower injury rates by 18 % while preserving xG output.

3. Data Collection & Framework
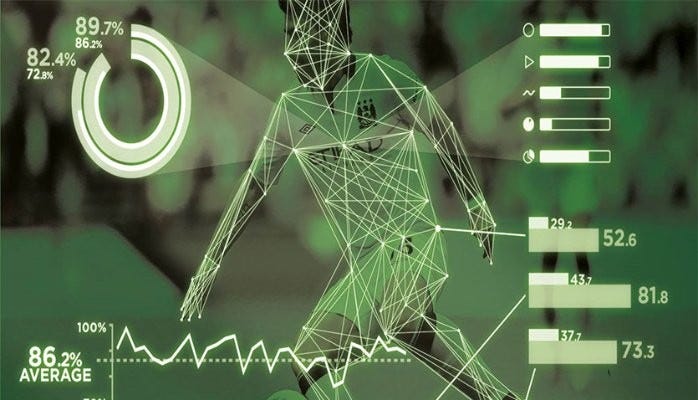
Optical tracking (e.g., TRACAB, Second Spectrum) captures 25 fps positional data, while wearable GPS logs metabolic load. Feeding both streams into a unified event database enables synchronized tactical and physiological views. Typical preprocessing steps involve:
– Coordinate normalization to account for pitch size variations
– Event tagging by synchronizing time codes from multiple broadcast angles
– Outlier filtering based on z-scores for accelerations > 8 m/s²
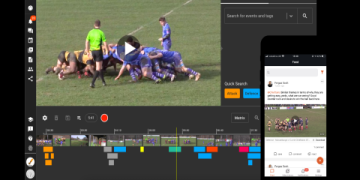
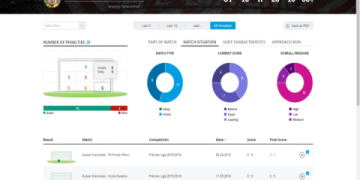
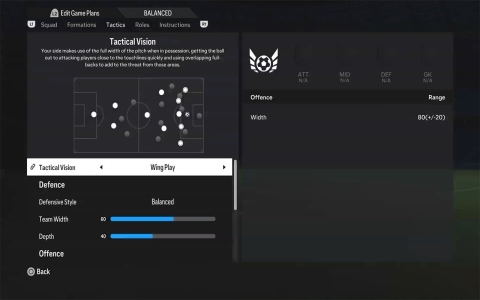
4. Visualization & Communication
Heat maps, pass networks, and defensive hulls convert complex data into coach-friendly visuals. Interactive dashboards allow filtering by match phase, player rotation, and opponent strength. Embedding short video clips beside each visualization anchors abstract numbers in concrete game context, accelerating buy-in from technical staff.
5. Case Study: Improving a Mid-Table Club
A team finishing 12th with a –6 goal difference implemented the framework outlined below:
Step 1: Benchmarking – Their xG differential placed them 8th, suggesting under-performance linked to poor finishing.
Step 2: Micro-Analysis – Shot placement hex-bin plots revealed 42 % of attempts were central and within 10 m, yet conversion was only 9 %. Training shifted to shot-placement drills, emphasizing corner targeting.
Step 3: Transition Tuning – PPDA in the attacking third improved from 9.8 to 6.4 through coordinated five-second counter-press triggers.
Step 4: Rotation Optimization – Load management software redistributed minutes, reducing non-contact muscle injuries from 14 to 6.
Outcome: Next season the side finished 7th with a +9 goal difference and qualified for European playoffs, adding an estimated € 18 M in broadcast revenue.
6. Practical Implementation Checklist
– Integrate data engineer and performance analyst within the coaching staff to ensure real-time relevance.
– Establish 3–5 “North-Star” KPIs agreed upon by manager and sporting director to avoid data overload.
– Conduct adversarial analysis: simulate opponent tendencies in training to validate tactical tweaks suggested by data.
– Update benchmarks every six matchdays to capture form fluctuations without overreacting to short-term noise.
– Secure player trust by emphasizing development narratives rather than public criticism.
7. Future Directions
Machine-learning models now forecast injury risk and simulate match outcomes under various tactical adjustments. Player-worn IMUs paired with computer-vision ball tracking will soon enable automatic tactical periodization, calibrating training intensity to upcoming opponent profiles. Federations experimenting with semi-automated offside micro-chips already envision a future where real-time analytics influence live coaching interventions.
Conclusion
Objective performance analysis strips subjectivity from football evaluation, replacing hunches with measurable patterns. Teams that institutionalize data-driven decision cycles not only convert draws into wins but also build sustainable competitive edges in recruitment, injury prevention, and player development. The clubs investing today in rigorous analytics infrastructures will be the ones lifting silverware tomorrow.


